Matrix Reports in Salesforce: Reports that let you group records by row and column are called matrix reports. Where similar totals can be compared, including totals by row and column, use matrix reports to display your data according to two unrelated dimensions, like date and product.
Within the ever-changing field of customer relationship management (CRM), Salesforce is a shining example of efficiency and creativity. The Matrix Report is a crucial component that enables organizations to make data-driven decisions. With the help of this flexible report type in Salesforce, users may thoroughly and systematically analyze and visualize large, complicated data sets. We will go into the nuances of Matrix Reports in this blog article, examining their features, advantages, and potential to revolutionize sales teams.
Table of Contents
ToggleWhat is Matrix Report
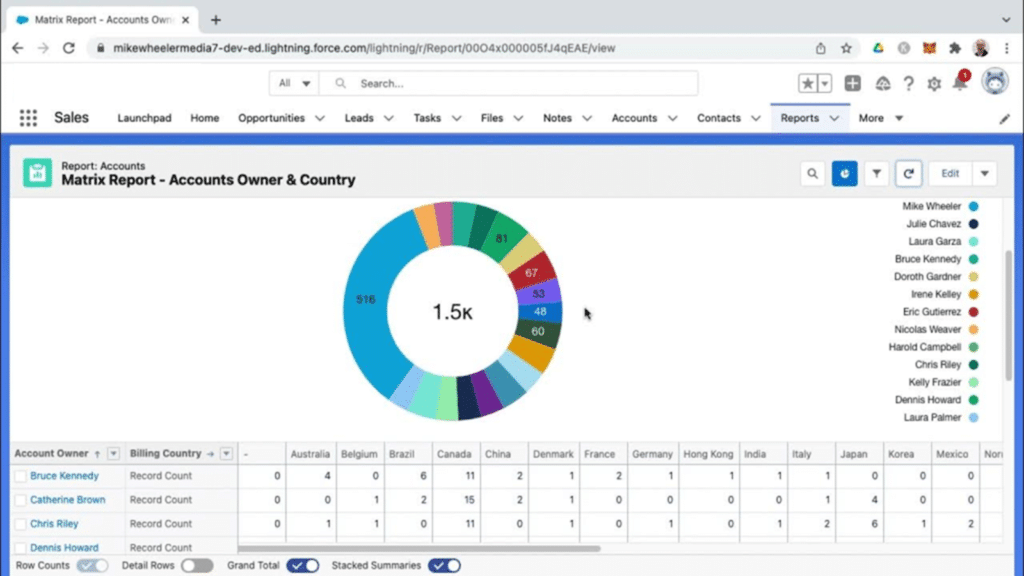
You can display the data in various dimensions with a matrix report. It’s a summary report that rows and columns can sort.
The most intricate report available in Salesforce is this one, typically used to compare related totals.
You should use matrix reports.
Analyse information in various ways (e.g., the total number of sales per sales representative over time).
Make highly customized reports. Data can be summed up for records using rows and columns in matrix reports.
- Related tools are compared using the Salesforce Matrix report.
- Dashboard components can be sourced from reports in matrices.
- Vast volumes of data are summarised using this.
Create a Matrix Report In Salesforce
Creating insightful and thorough reports in Salesforce is critical for analyzing data, getting new insights, and making informed business decisions. A matrix report is a sophisticated reporting feature that allows users to organize and show data in a matrix manner, allowing them to see their Salesforce data from multiple perspectives.
Organizations can use matrix reports to compare data across categories, analyze trends, and detect patterns.
Make a Matrix Report
Information is compiled using both rows and columns in a matrix report.
Any tabular report can be transformed into a matrix report by modifying it.
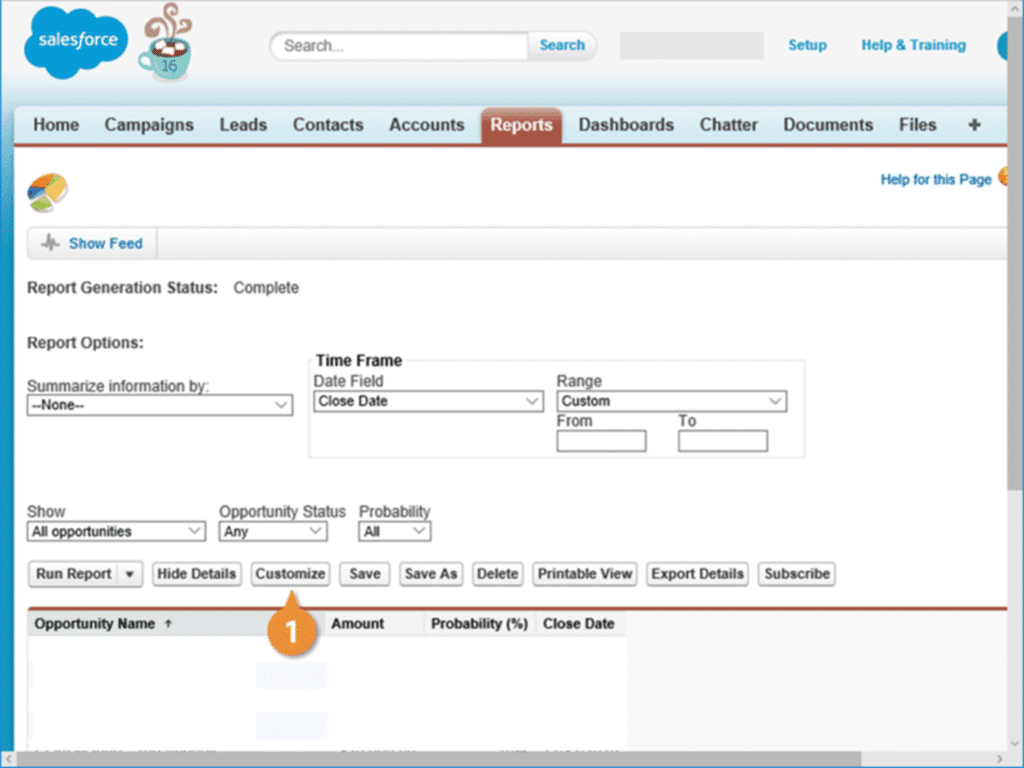
Select Matrix by clicking the Summary Format arrow.

The fields you wish to utilize as your row and column titles must be added.
To move the row header field to the row header area, click and drag it.
The report is grouped by the rows you choose in Salesforce.
To move the column header field to the column header area, click and drag it.
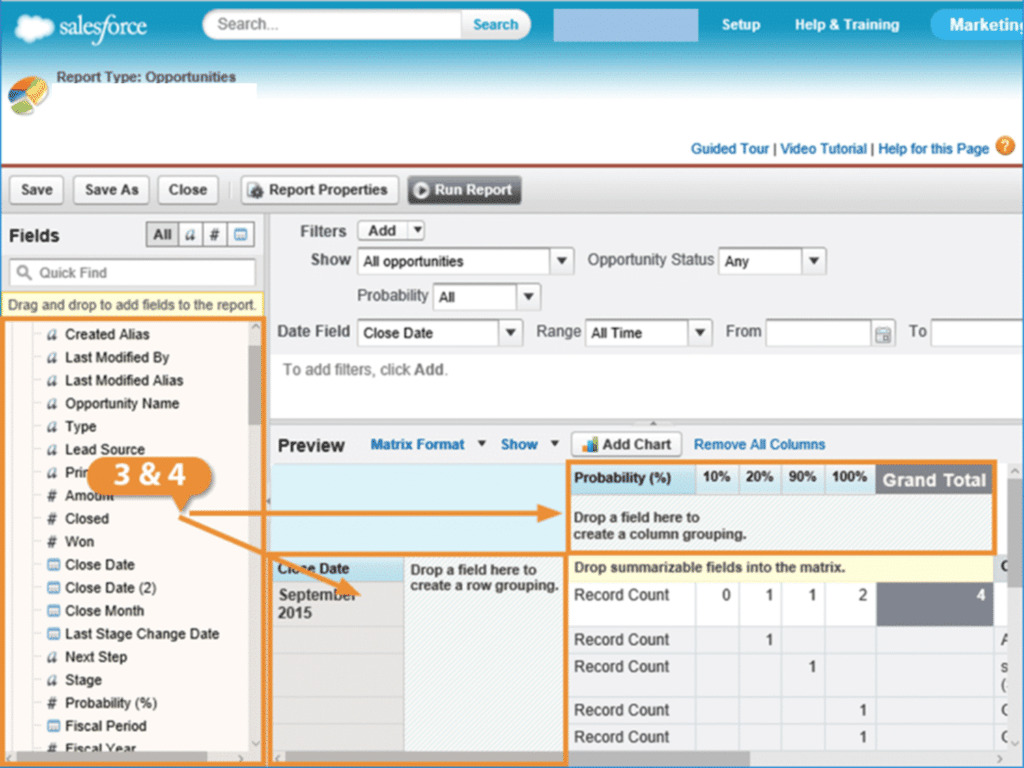
The information is summed up in the report using the rows and columns that you designated.
Lastly, you have the option to define which fields to calculate.
To choose a computation, click the arrow next to any field, choose Summarise this Field, and then click again.
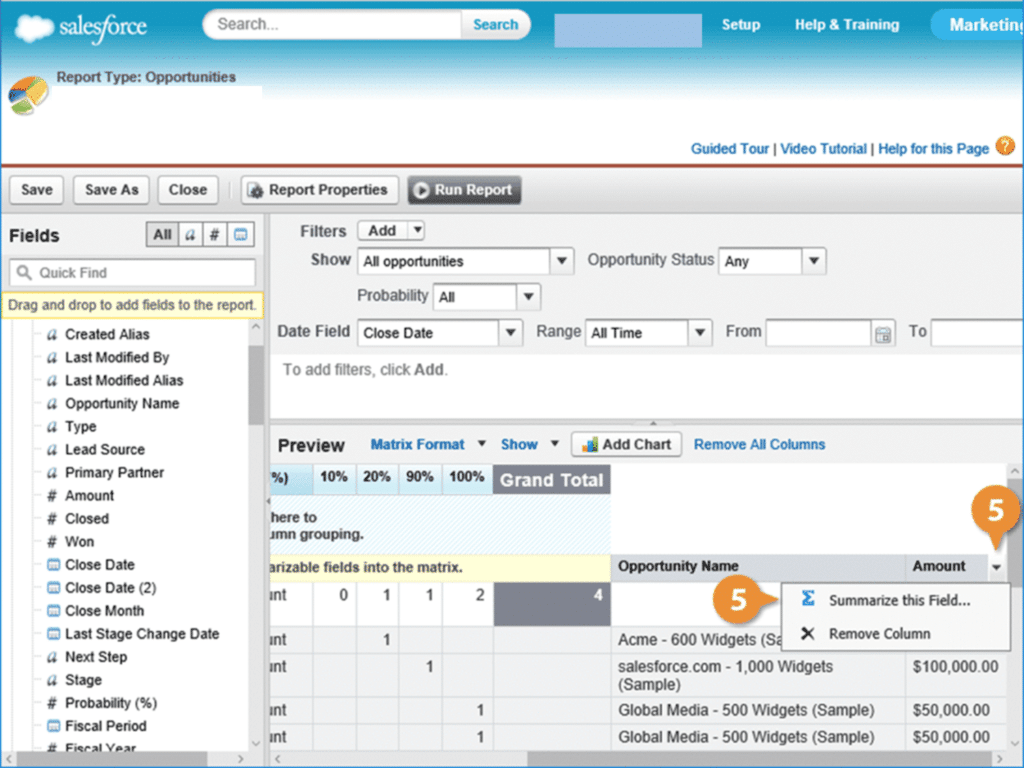
Check the calculations you want and click Apply.
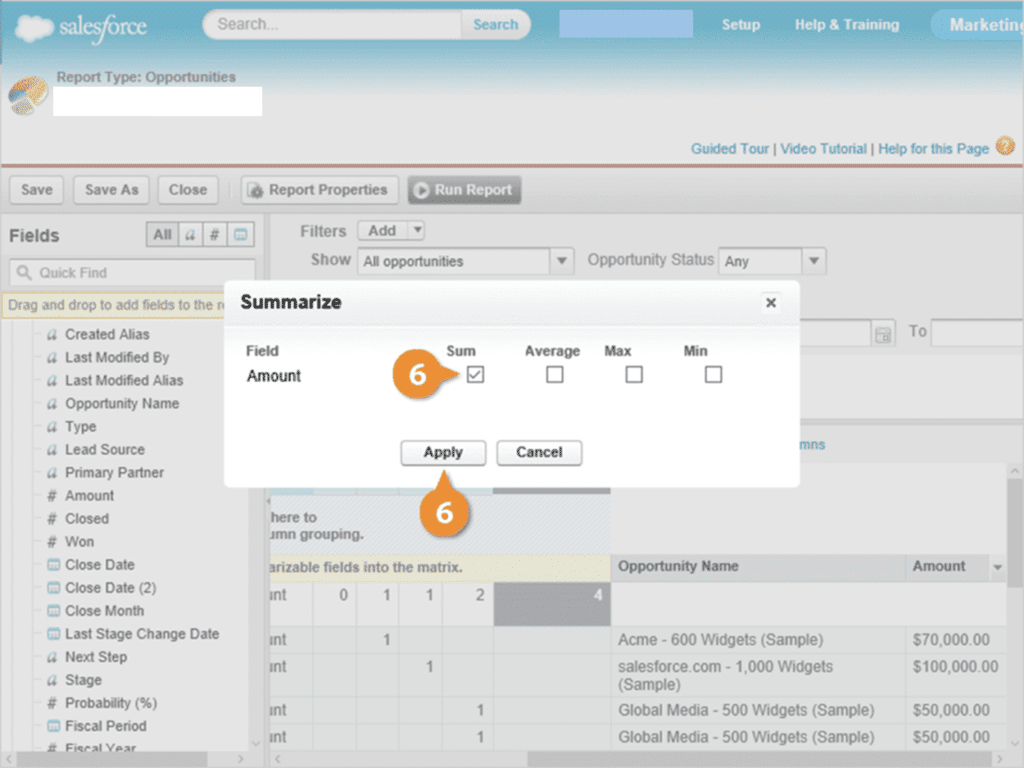
The fields you selected are used to generate a matrix report.
Advantages of Matric Report

Cross-Category Data Analysis
A matrix report in Salesforce allows users to analyze data from various categories at the same time. Users can compare and analyze data across different dimensions, such as products, geographies, periods, or any other custom categories, by organizing data into rows and columns. This cross-categorical analysis provides a comprehensive perspective of data relationships, allowing for detailed insights and sound data-driven decision-making.
Aggregated Data summarising
Salesforce matrix reports provide sophisticated data summarising capabilities. Summary formulas and aggregate data can be defined by users within matrix cells, providing a consolidated view of critical metrics and totals. Users can utilize this summarising feature to swiftly assess overall performance, discover trends, and compare data across several categories inside a single report.
Visual Representation
Matrix reports present data in an appealing and straightforward style. Users can use charts, graphs, and colour-coded cells to display data within the matrix report visually. Visual clues help spot patterns, outliers, and trends quickly, allowing stakeholders to understand crucial information at a look. Data visualization improves comprehension and allows efficient transmission of insights inside organizations.
Dynamic Drill-Down features
Salesforce matrix reports include interactive drill-down features that allow users to explore data at multiple degrees of detail. Users can drill down into the underlying data by clicking on summary cells, revealing more granular information. Users can use this dynamic drill-down feature to go further into specific data points, explore anomalies, and thoroughly understand the factors influencing results.
Comparative study
Matrix reports allow users to survey, closely adding many categories within the report layout. Users can compare data across multiple dimensions, such as sales performance by product and location or customer satisfaction ratings by period and department. This comparison study helps stakeholders find patterns, correlations, and performance gaps, allowing them to make educated decisions and take relevant measures.
Conclusion
Matrix Reports in Salesforce are a cornerstone of practical data analysis and decision-making. Their unique ability to present data in a multidimensional format, robust visualization options, and drill-down capabilities make them an invaluable asset for businesses across various industries.
Whether optimizing sales strategies, evaluating marketing campaign effectiveness, or enhancing customer support, Matrix Reports empower organizations to extract actionable insights from their data.
As businesses navigate a data-driven landscape, mastering the art of creating, customizing, and interpreting Matrix Reports becomes a strategic imperative. By incorporating best practices and leveraging the full potential of Matrix Reports, organizations can streamline their CRM processes and gain a competitive edge in today’s dynamic market.
The journey from data to insights becomes seamless, allowing businesses to make informed decisions that drive success and growth.


