Install it here
Debugging your web apps is one of the most difficult task for any web developer. One of the main reason behind the popularity of google chrome browser among web developer is its great set of Developer tools. Even with great set of tools available, developers still face challenges with apps that depend on DOM generation, especially the apps that built with Lightning Components.
With increase demand of apps that provide beautiful user experience and are compatible with desktop and mobile devices,Lightning components come to play. With the help of Lightning components,app builders create self-contained and reusable units which once created let you build cross-device application at lightning fast speed with just drag and drop.
In order to debug these lightning component application, we also have a new Salesforce Lightning Inspector. With Salesforce Lightning Inspector, you will get access to wealth of data about your lightning application and its components.
Benefits of using Lightning Inspector:
- You will able to navigate and inspect the structure of your components.
- Component creation time graph will help to identify performance bottlenecks.
- You will be able to debug server interactions.
- You will be able to navigate through component tree,inspect components and their associated DOM elements.
- You will be able to track event firing and handling sequences.
Now let’s play with our new tool:
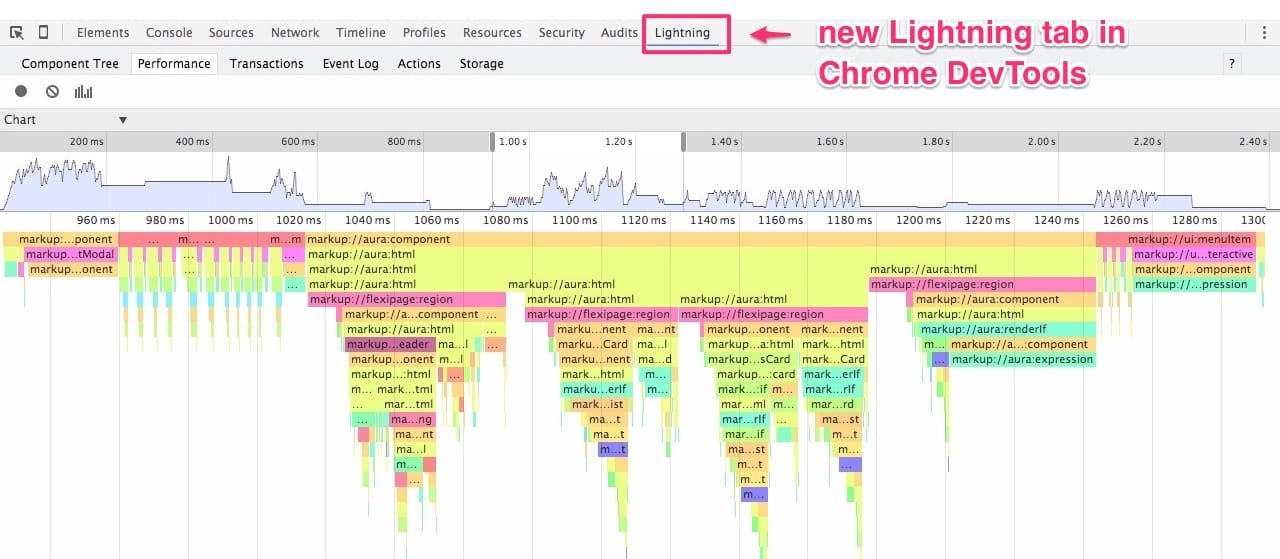
Once you installed Salesforce Lightning Inspector, you will notice a new Lightning tab added at the top of the chrome DevTools.
As you can see, the Lightning tab is divided into six tabs:
Component Tree: this tab is used to inspect objects and values.
Performance Tab : helps to identify which components are slower and why.
Event log: inspect the events which are either triggered by code or by user interactions.
Actions: you can view and test the status of server-side actions.
Storage: it tells us about the client-side storage for Lightning applications.
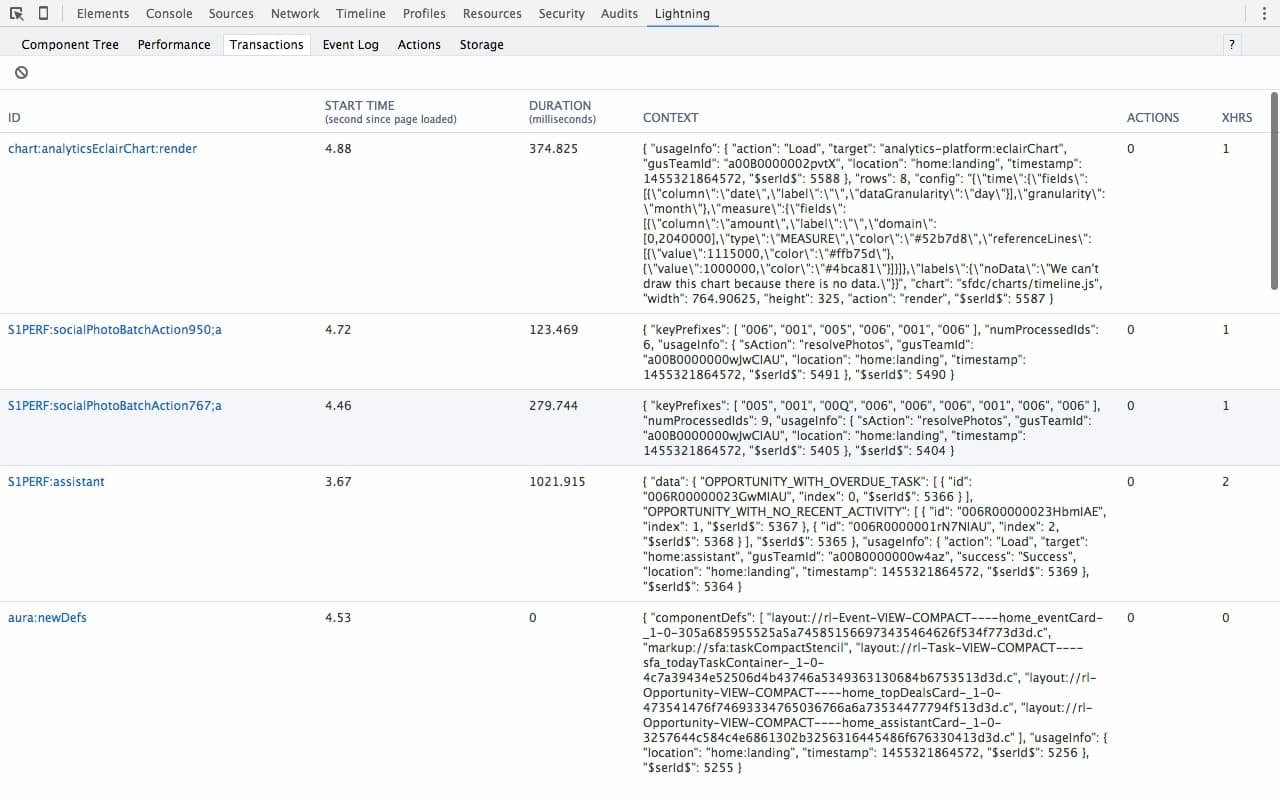
Transactions: see the recorded state(s) .
Please Note that Lightning component inspector is used to develop Lightning components, and they only work when we view an .app or .cmp file.
Let’s talk about each of these tabs in detail:
Component Tree tab: This tab provides an overview of the objects that make up our application, just like we have elements tab in the traditional Chrome Dev tools. However, the component tab also gives the ability to inspect individual objects in their “code state” without the overhead of the rest of the DOM. You can also view the current values of the Aura attributes, as we select individual nodes. This is very helpful and we don’t have to dig deep under the Network tab to find the return values for the API or database calls or using
console.log(myData)
Performance Tab: This tabs helps to identify which components are slower and also where in the component hierarchy the slowness occurred. In the Standard Profiles and timeline tabsof the DevTools only tells us about the general info related to our Lightning apps like size,loading/rendering time and potential performance hot spots which also includes framework and DOM levels.
But we can’t see information related to individual pieces that make up the component. With performance tab inside Lightning component inspector we can isolate inspection to the component code level.
Transactions Tab: With the help of transactions tab, we can view the recorded state(s) during parts of the application’s execution. The transaction data includes the amount of XHR’s that were sent, the actions that were called and the time those actions took place.
Event Log tag: An important part of Lightning components is its use of events and triggers. Up till now, we’ve been left with debugger statements, breakpoints and boring console.log() statement ti debug events and triggers. With the help of event tab, we can inpect the events being triggered either by code or human interaction. We can also view which component handled the event using this tab.
Actions Tab:Lightning components are client side entities, but these components interact with Apex controllers.So far we never had a chance to see when an Apex controller is queued,running or has finished firing. But with the help of Actions tab under Lightning Inspector, we can see the status of these server-side actions. We can also test the fault tolerance of our client-side component code by modifying server-side component results. For e.g. we want to see what would happen if an action failed to execute,or it returned an error or returned an unexpected value.
Storage tab: As a web developer , you know that one of the most important reasons of performance bottlenecks is the trip to ther server. The Storage tab reveals the client-side storage for Lightning applications.
Actions which are marked as storable are cached in the actions store. Whenever a storable action runs, it will use the value from actions store if available which will avoid a server trip altogether which will make your components run faster. With the help of storage tab you can see view which actions are cached, the size of each cached action and even where the cache resides.
What’s next:
Steps to install the salesforce Lightning Inspector
Learn about Salesforce Lightning https://mytutorialrack.com/salesforce-lightning-framework/


