Creating Reports in Salesforce: The most helpful tool you have available to you may be Salesforce reports. Given the volume of data in your Salesforce organization, you must understand how to generate reports in Salesforce so that users can see the information that matters to them.
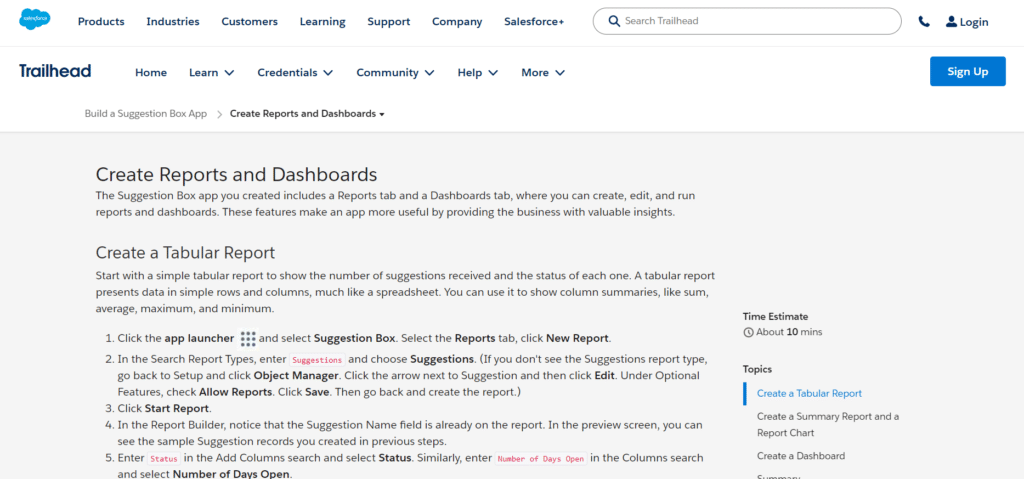
A list of filtered records is what Salesforce reports are. They function effectively for businesses of all shapes and sizes and are robust, user-friendly, and adaptable—just what you would expect from the top CRM in the world. Users generate reports, apply filters, and specify which fields to display using the Salesforce Report Builder. You may run and modify various pre-built reports, but you can also generate custom reports tailored to individual users’ needs.
Table of Contents
ToggleSalesforce Report Types
You may build four kinds of reports in Salesforce: Joined, Tabular, Summary, and Matrix. In a report, each one is ideally suited to display various types of data based on your desired outcomes.
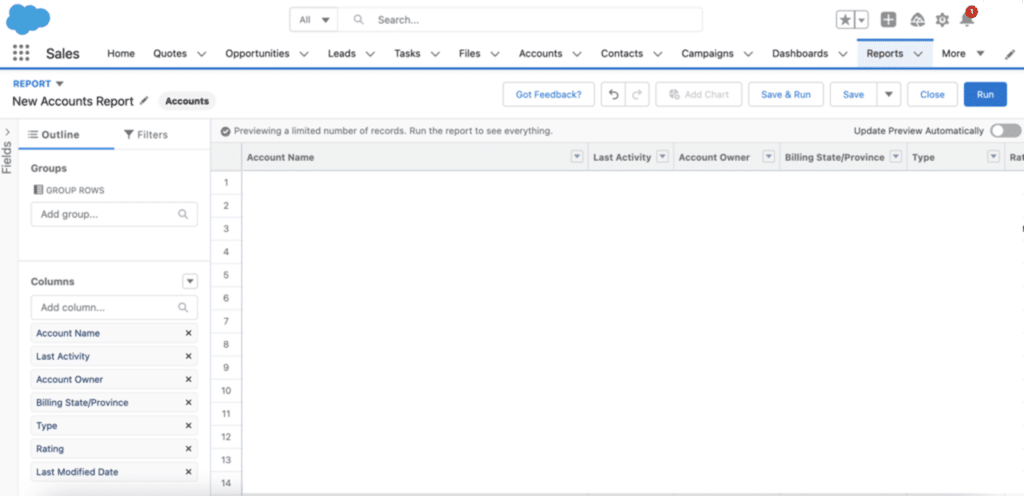
Tabular: This type of report is the most basic and is best used for displaying only data lines. It resembles a spreadsheet in Excel. This is the report for you if all you want to do is display data without the requirement to display totals, calculations, or data groups. If you intend to export data, this report type is also ideal.
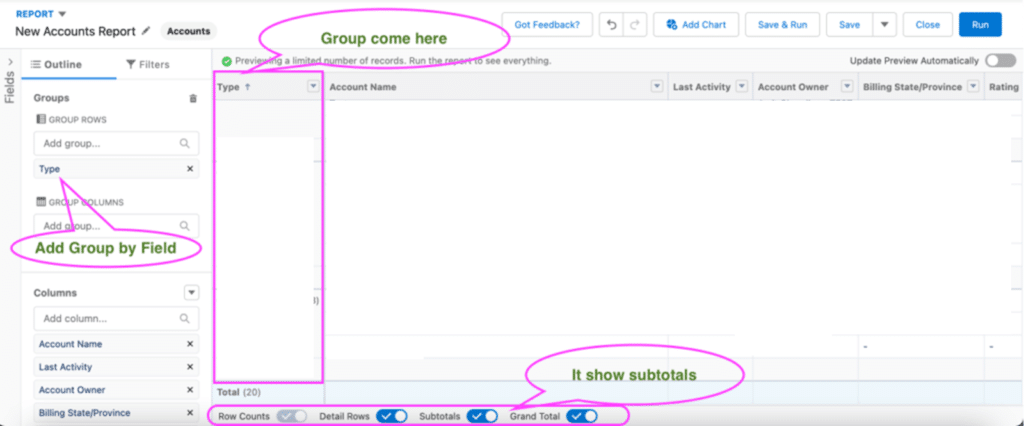
Summary Report: Upon adding a grouping, the report will become a summary report. The most popular type of reports are undoubtedly summary ones. They work well for grouping data; for example, you may group your report by Account Name to examine the quantity or value of opportunities per account. Fields can also be sub grouped by dragging them beneath the parent group.
Matrix: Matrix reports are similar to summary reports, except you can see different totals by grouping rows and columns. Extending the preceding example, you may view each account’s monthly worth of opportunities. Consequently, Edge Communications offers chances worth $100,000 in January, $50,000 in February, etc.

Joined Reports: You can generate two distinct reports for data comparison using bound reports. To display the entire number of opportunities and cases for each account side by side, you can utilize a Joined report.
How to Creating Reports in Salesforce
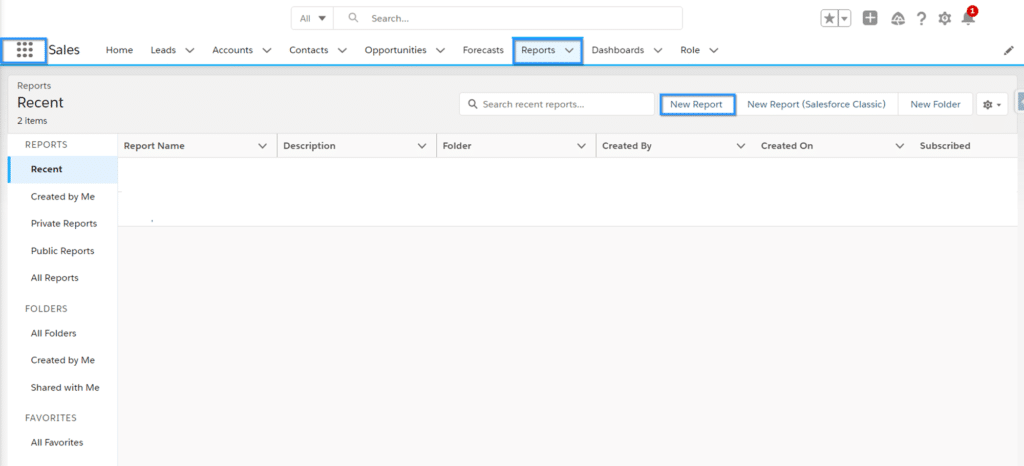
Tabular Report: Navigate to the Reports tab to begin. Click the App Launcher (9 dots) if you cannot view it. Click “New Report” after that.
The next step is to choose the report type containing the standard and custom object(s) you want to report on. When you click on the name of any report type, a side panel will show you additional information (like the objects included in the report type) and which fields you can filter or display in the report. Both standard report kinds (such as Accounts or Opportunities) and custom report types have access to this information.
I’m going to make an accounts report for this example. Select “Start Report.”


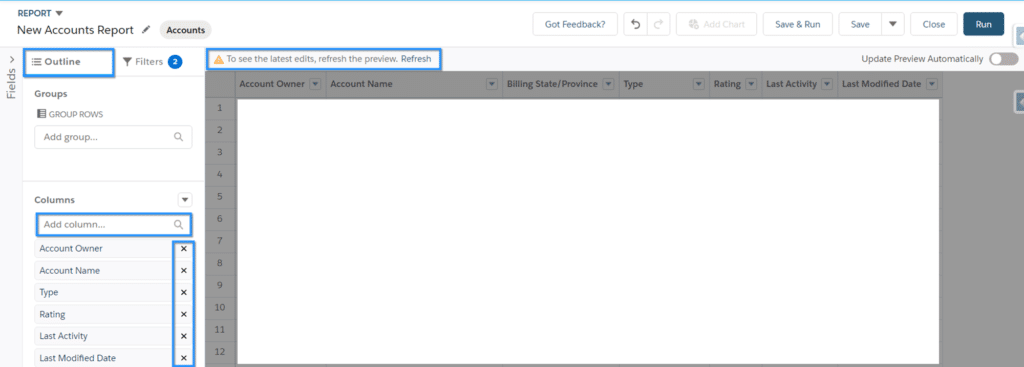
You’ll be directed to the canvas of reports. Clicking on the “Filters” tab lets you choose your filters first.
It is possible to add custom filters and update the built-in filters.
If “Update Preview Automatically” is deactivated, you will need to refresh to view your findings.

Proceed to the “Outline” page to select the fields shown in your report. There are fields in native reports that are offered by default. You can add your fields by searching for the field name and choosing it, or you can delete them by clicking the “X” next. You can rearrange fields by dragging and dropping them in a different sequence.
Remember to click “Refresh” to view your most recent report!
To see your report, click “Save & Run.” It will require you to choose the folder to put it in, give it a name, and, if desired, a description. Next, select “Save.”
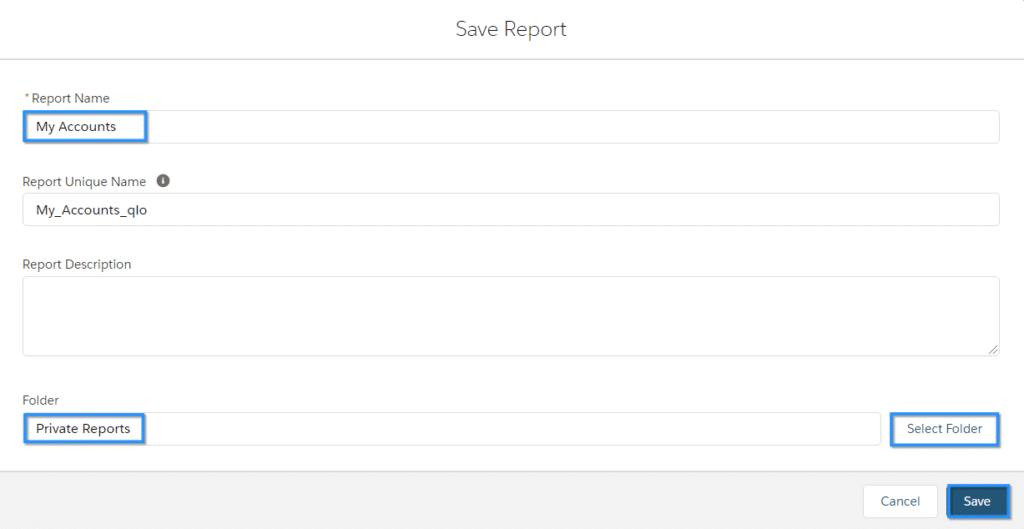
I’ve made a tabular report of my accounts that is ready to be exported if necessary.
Limitations of Salesforce reports
Unfortunately, there are some restrictions with the Salesforce report builder.
One drawback is that it does not offer visualization. Therefore, you will need to create any necessary graphs or charts independently. Additionally, reports have a ten-minute time limit; if your data takes longer than that to make, Salesforce will cancel the report.
As the data is cached, you can try rerunning it, but there’s no guarantee that it will work the second time.
Furthermore, reports can only include 2,000 rows of data; export the report to a spreadsheet and perform further analysis if you require more.
Furthermore, reports can only function with the already existing data; they cannot be used to add new data points or alter ones that already exist because they are dependent on system objects. This implies that you must look for an outside solution to perform complex computations or data processing.
Frequently asked queries concerning report creation in Salesforce
In this section, we’ve addressed some of the most popular queries regarding creating Salesforce reports.
In Salesforce, how many different kinds of reports are there?
You may generate tabular, summary, matrix, and combined reports in Salesforce, which are the four primary report kinds.
What distinguishes dashboards from reports in Salesforce?
In Salesforce, there are two distinct ways to display data: reports and dashboards. Dashboards present the data in a graphical style for quick scanning for insights, whereas reports show the raw data.
Both let you see and evaluate several data sets simultaneously, making them valuable additions to your toolkit.
How can I set a report’s schedule in Salesforce?
Click the Schedule button after selecting the report you wish to schedule. Next, you can choose the repetition frequency (daily, weekly, monthly, etc.) and provide an email address to which the report should be sent.
How do I sign up for a report from Salesforce?
Click Subscribe after selecting the report you wish to subscribe to. Next, you can choose how often you want to receive the report (daily, weekly, monthly, etc.) and provide your email address.
In Salesforce, how do I share a report?
Click Share after selecting the report you wish to distribute. Next, you can choose who you want to share the report with by entering their email addresses and degree of authorization (view only, modify, etc.). An expiration date can be included to indicate when the shared link will expire.
Conclusion
Anyone hoping to glean insights from their CRM data will find that creating reports in Salesforce is a valuable skill. Understanding report kinds, choosing the appropriate fields and filters, creating efficient layouts, and utilizing visualization tools can help you produce reports that will enable your company to make wise decisions.
Remain flexible, investigate cutting-edge functionalities, and consistently enhance your reporting approach to maintain an advantage in the dynamic business environment.
It’s time to construct your following Salesforce report to examine your sales data now that you know the many report formats available in Salesforce and have mastered the creation of reports and custom report types.


